I’m a newbie on Cumulocity dashboarding, using version 1018.0.271.
I am trying to use the SCADA widget to display an SVG using all devices of the selected group, but I can’t find how to do so using the official documentation : Monitoring the device status using the SCADA widget.
The documentation specifies that we can use ng-repeat, and we can also select a whole group of devices as data source, but it doesn’t say how to interact with device or group themselves.
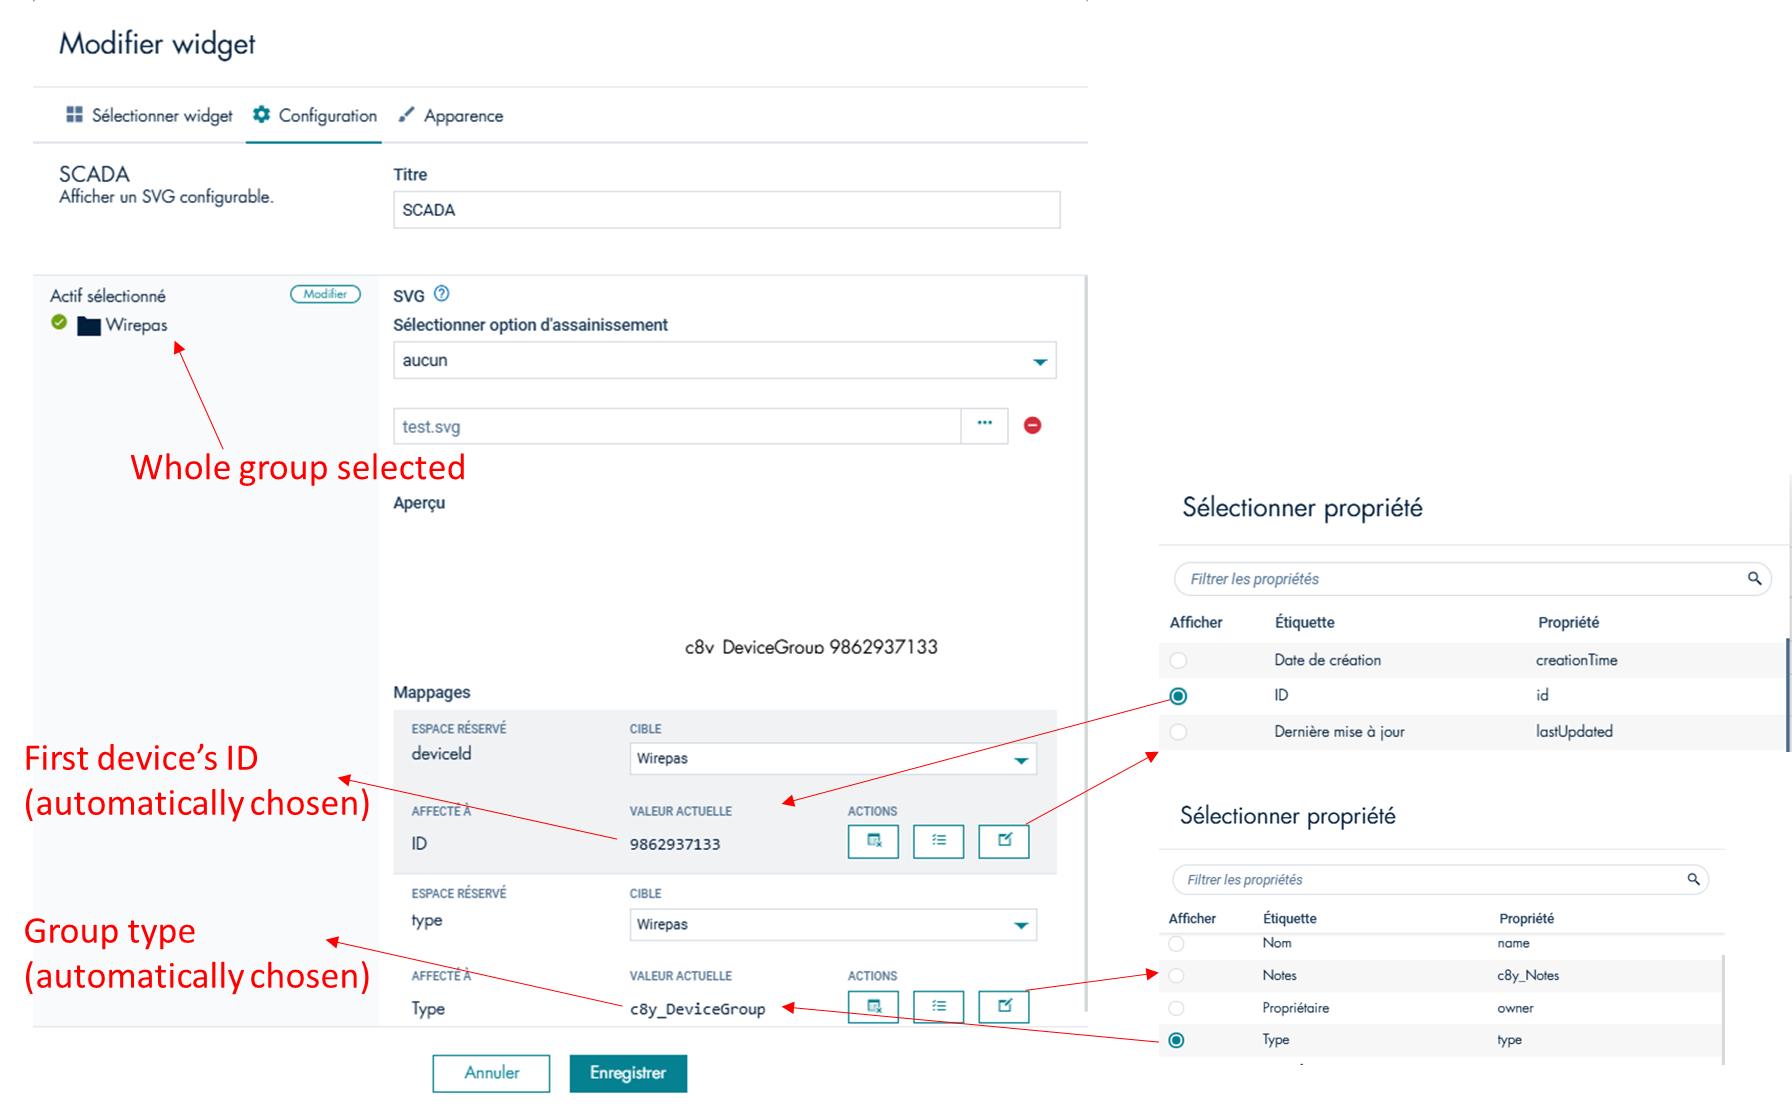
The dropdown where in your screen “Wirepas” is selected should contain the group and all child devices.
So you can select a child device and do the mapping accordingly. Unfortunately you have to do that for each device + property. I don’t think there is an option to dynamically visualize a property for all devices within a group unfortunately.
Btw. the selected ID is not the device ID but the group ID. So what you are visualizing is actually all properties of the group not of any device. If you select “Last Measurement” you can also select a data point from a child device, but again each mappings is only 1:1 (SVG tag : device property). No dynamic mapping is possible if devices are added/removed from the group.